google_cert_project
Final Project for the Google Data Analytics Certificate Course
This is an analysis of rides data from “Cyclistic”, a fictional bike-share company. Users remove a bike from one of the company’s many stations around Chicago, and then return it to the same station or any other station. This is a “ride”.
The company has two kinds of users, “casual” users and “members”. Members pay a yearly fee. Casual users pay by the ride or by the day.
The Question
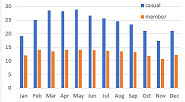
“How do annual members and casual riders use Cyclistic bikes differently?”
The Data
The data is really data shared by a real bike share company. CSV files of data about individual trips were downloaded from here: https://divvy-tripdata.s3.amazonaws.com/index.html
Data is available under this license: https://ride.divvybikes.com/data-license-agreement We will use data from the last twelve complete months, December 2020 through November 2021.
Aanalysis: R Notebook
- Read raw csv files
- Combine and clean the data
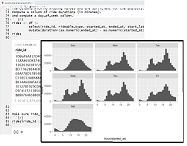
- Analyze for patterns
- Export summary CSV files which were small enough to open in Excel


